
HOW A NEW SPECTROPHOTOMETER ADDS NEW DIMENSIONS OF LEARNING AND DISCOVERY IN CLINICAL LABORATORY EDUCATION
Gerald D. Redwine, PhD, MT(ASCP), ASCLS Chemistry/Urinalysis Scientific Assembly Chair
Technology has taken cognition to the highest levels of learning in our labs, especially the technology for enzymes over the last three years on newly-acquired spectrophotometers. More than 30 years of using the faithful Gifford spectrophotometer slowly came to an end following impossible- or difficult-to-replace parts. But the replacement Lambda 265 photodiode array UV Vis spectrophotometer by PerkinElmer has more than made up for it. In vogue with today’s tech-savvy student, the technology adds new dimensions of learning and discovery; impossible in past chemistry labs. As a side note, it is also capable of doing certain molecular labs, but that is for other professors to discover.
| Figure 1 Analyzer and laptop, comparable L x W, and weight. |
 |
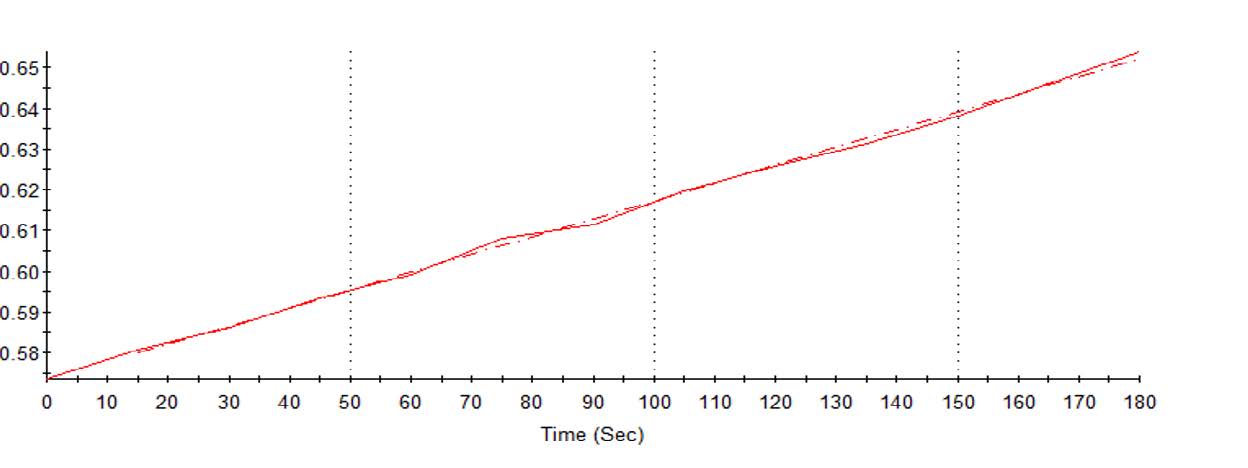
| Figure 2 Real-time measurements at 15-second internals. |
 |
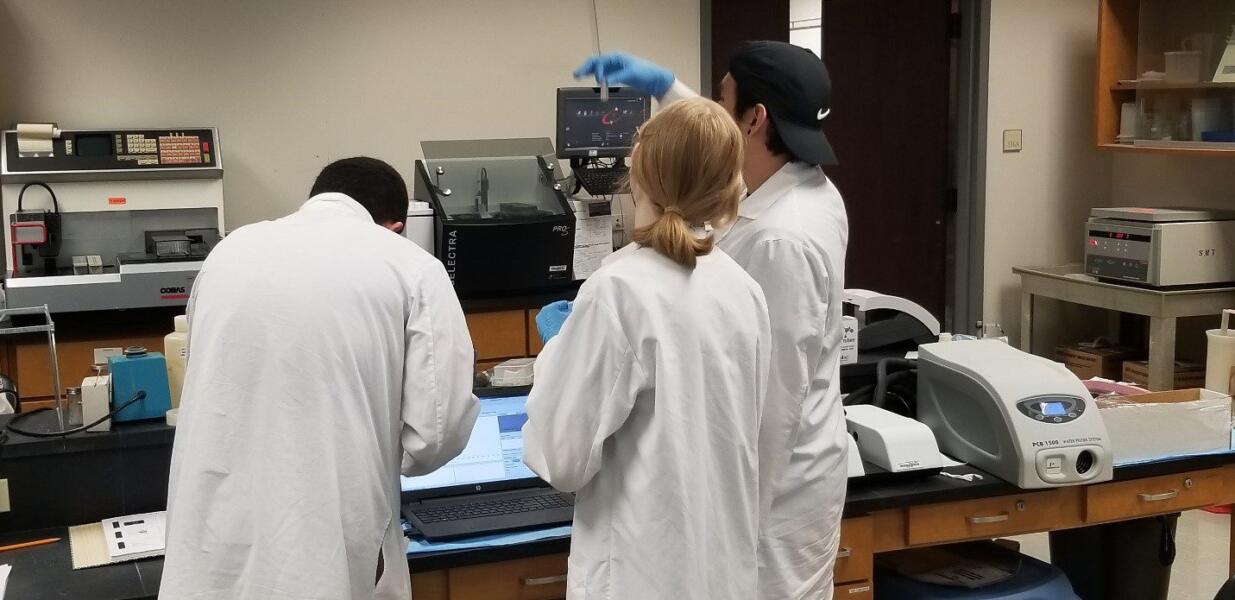
Following the initial setup, the need for support was nonexistent. Working with the laptop computer program and the small footprint analyzer (Figure 1) is relatively simple. We added other accessories such as the flow cell with a peristaltic pump (not shown) that sets between the laptop and analyzer. We also added a “Water Jacketed Single Cell Holder,” located between the horseshoe-shaped analyzer, and its temperature regulated “Peltier Controlled Fluid Circulator,” seen to the right of the analyzer. The analyzer is truly an open system, not only for reagents but regarding its open spectral analysis, worry-free of stray light due to its high energy xenon flash lamp.
Altogether it means that for the first time students can see, in real time, endpoint and kinetic reactions as the computer presents or graphically tracks the reactions at programmed intervals of choice to completion (Figures 2, 3). This ability accentuated learning beyond recall and comprehension to the higher level of application in Bloom’s taxonomy.
The days of recording point-by-point enzymatic activity on graph paper are over because students can right click, copy, and paste any or all resulting data or graphics into one or several media like Excel (Table 1), Word, or PDF for future reference. Students also can simply click “Export,” with some selectivity to similar media.
Even more exciting, students in the included example observed in real time the enzymatic activity. They zoomed in during and following the kinetic reaction and witnessed the positive (increasing) variance in the alkaline phosphatase (AP/ALP) activity while remaining compliant with the manufacturer’s test requirement (Figure 2). Cognitive discussions ensued concerning the abstract concept of Lambert-Beer’s Law and the resulting equation (Absorbance = 2-log%T)1,2 relating absorbency to transmitted light.
The ability to export data into an Excel file (Table 1) made the analysis a snap and facilitated transitioning to even higher levels of cognition. They selected the most stable minute from Figure 2, compared it to values in Table 1, and completed their calculation to quantitate the AP activity.
Table 1 Exampled Alkaline Phosphatase (AP)
| Time (Sec) | 405.000nm | ΔA | ΔA/min |
| 0 | 0.574 | ||
| 15 | 0.581 | 0.007 | |
| 30 | 0.586 | 0.005 | |
| 45 | 0.593 | 0.007 | |
| 60 | 0.599 | 0.006 | 0.025 |
| 75 | 0.608 | 0.009 | |
| 90 | 0.611 | 0.003 | |
| 105 | 0.620 | 0.009 | |
| 120 | 0.626 | 0.006 | 0.028 |
| 135 | 0.631 | 0.005 | |
| 150 | 0.638 | 0.007 | |
| 165 | 0.646 | 0.008 | |
| 180 | 0.654 | 0.008 | 0.028 |
Equation:
U/L= ΔA/min × 1000 × 1000 × tf × tvr
Molar Absorptivity x lp × sv
- ΔA/min – change of absorptivity/min
- Molar Absorptivity for Alkaline Phosphatase, 18,880
- 1000 – converts mL to a liter
- 1000 – converts millimoles to micromoles
- tf – temperature factor, usually 1.00
- trv – total reaction volume
- lp – light path in centimeters, 1.0
- sv – sample volume in mL
Results in SI Units/Liter (U/L):
U/L= 0.028 × 1000 × 1000 × 1 × 1.02 mL = 76 U/L (Ref.30 -165)
18,880 x 0.02 mL
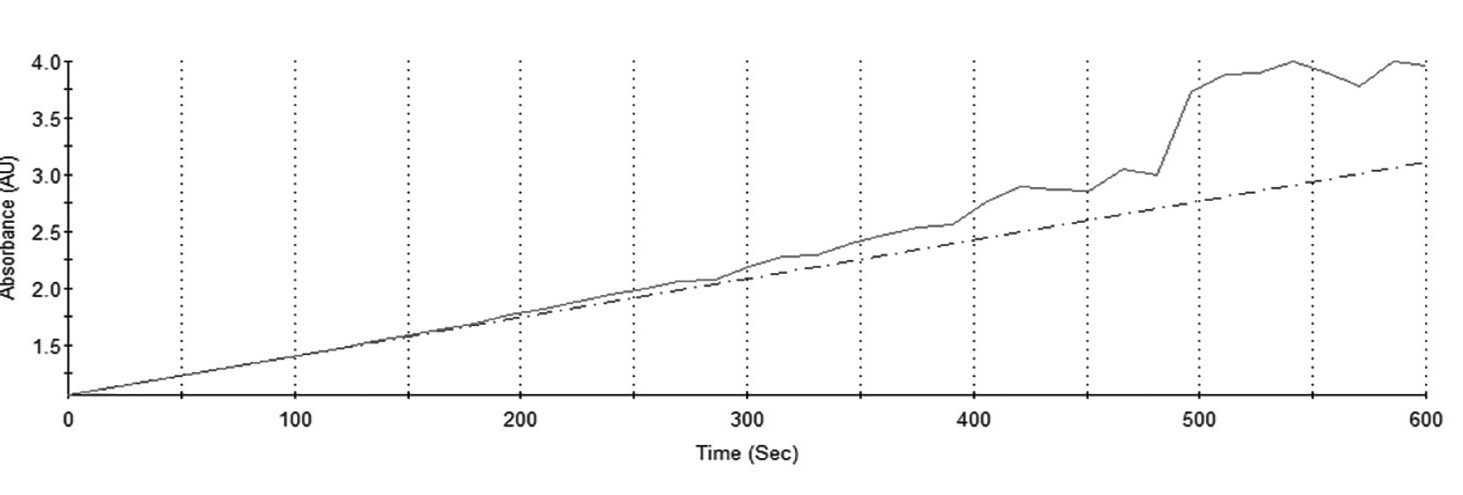
| Figure 3. Extended real-time measurements at 15-second internals |
 |
In the past, manually graphing point-to-point reactions was the only choice without the real-time monitoring capability, which limited the desired learning outcome to a calculated result. However, with technology, although the goal of getting a result from the analysis was complete, learning continued.
Reflecting on the meaning of all they had accomplished catapulted the students to the next higher level of cognition in Bloom’s taxonomy, synthesis, by predicting that similar reactions would occur with other enzymatic reactions. With assistance, students then moved into the highest level of cognition, evaluation. They focused on the AP measurement frequency of 405 nm in an experiment, then the spectral evaluation at two points. The beginning and the end of the analysis, with an absorptivity of 0.574, and 0.654 respectively, as indicated in Table 1, facilitated the learning.
Admittedly, students needed guidance in expanding their knowledge into the realm of evaluation, accomplished with a “what if” experiment. Testing to see what extending the number of minutes of testing (Figure 3) would accomplish succeeded in reaching the highest level of cognition, evaluation. So, what did they discover? Three things quickly became obvious, which stimulated other learning investigations.
First, they found that a relatively small quantity of patient AP enzymes in the zero order (excess substrate) reaction did not exhaust it, as seen by the continual increase of product. Secondly, the longer the reaction, the greater the instability. Thirdly, the longer the reaction, the less predictable the rate of production. The visual results also begged for a future investigation of the lag phase by starting the measurement shortly after mixing the patient sample with the substrate.
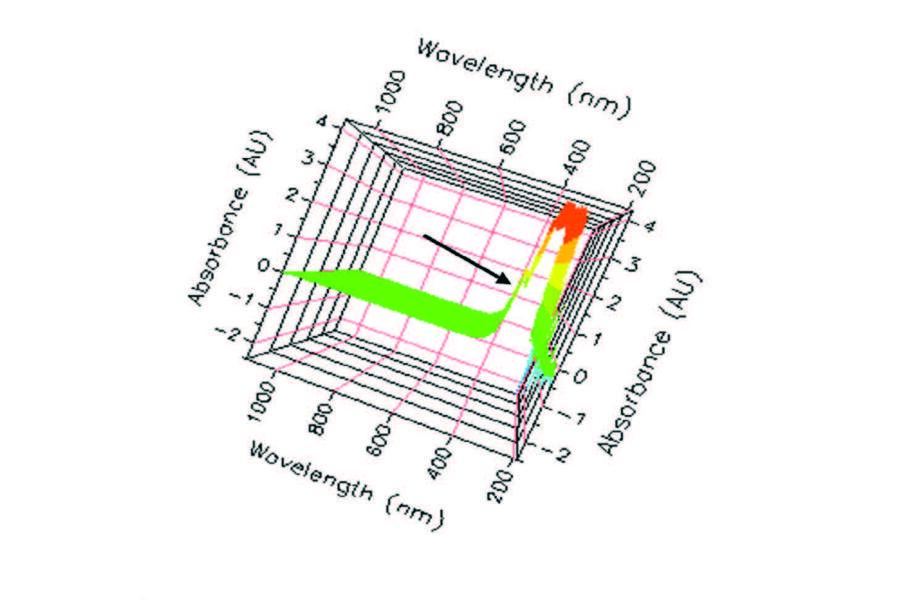
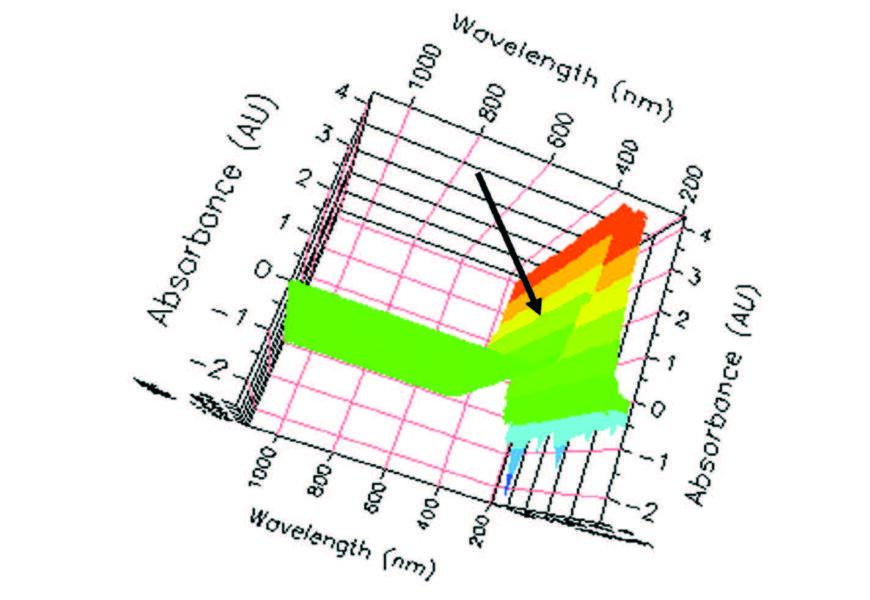
| Figure 4. Left slightly-upper 3D view, full spectrum scan, 405 nm indicated. |
 |
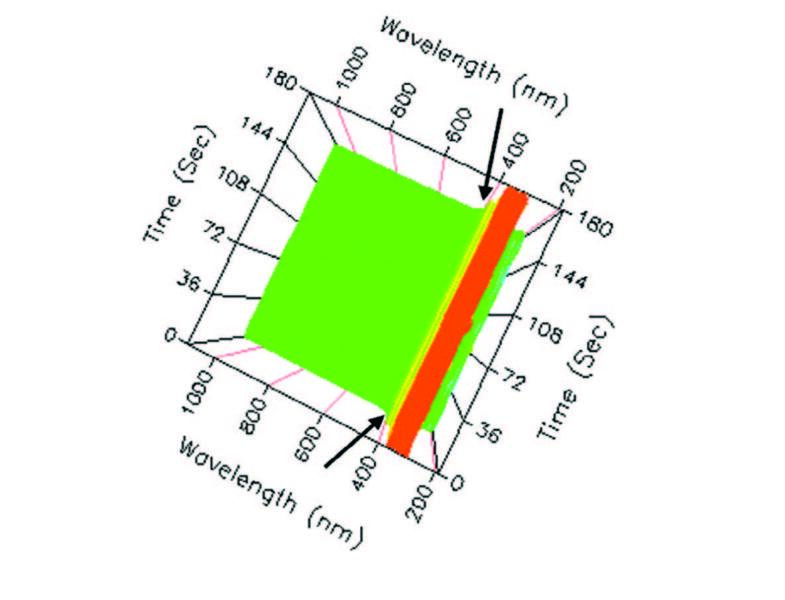
| Figure 5. Top 3D view, full spectrum scan, 405 nm indicated. |
 |
| Figure 6. Left lower 3D view, full spectrum scan, 405 nm indicated. |
 |
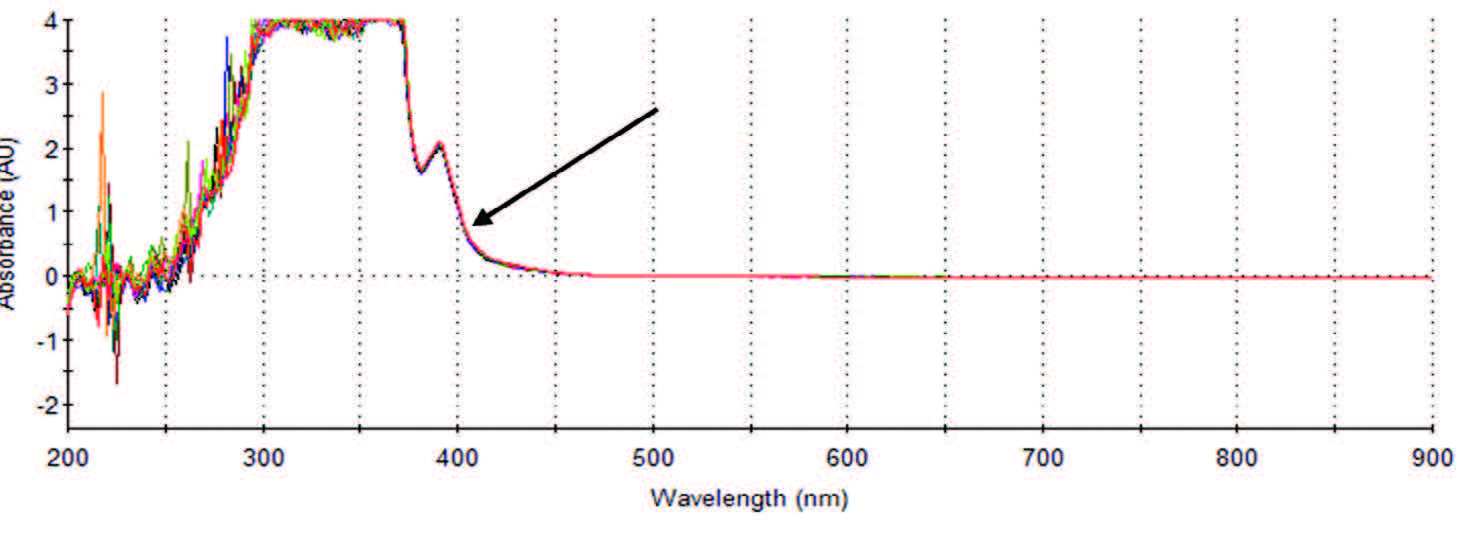
| Figure 7. Full spectrum scan truncated at 900 nm, 405 nm indicated. |
 |
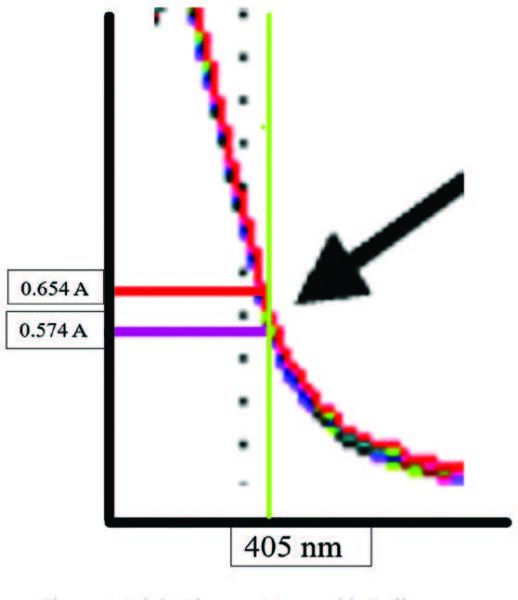
| Figure 8. Subtle changes measurable differences. |
 |
In the meantime, the ability for students to graphically observe the enzymatic reactions in real time helped facilitate learning at the highest level of cognition and encouraged them to delve into research of spectral analysis; in short, it facilitated critical thinking. Students discovered that the spectrum was examinable not only in 3D but any angle could be examined, each with their advantage. For example, Figure 4 revealed to the students that absorbances beyond 2A were possible and had a very similar pattern throughout the spectrum from 200 nm to 1100 nm. That is, most of the activity was between 200 nm and slightly more than 400 nm. Also, how and why the manufacturer decided to use 405 nm as the point of measurements became a point of interest.
From the top (Figure 5) the spectral scan reveals a similar pattern over time. That is, some pre-activity, followed by heavy activity, and resolve to post activity. Nevertheless, similar results came from the products beginning with the initial timing and continued throughout the three minutes. Surprisingly, perhaps the best view was the lower view (not bottom) in Figure 6 that revealed several interesting facts including the reason for selecting the wavelength at 405 nm for measurement.
The first note of interest is the increasingly larger negative values and increasingly larger negative spikes in the UV range over time. A careful study of these negative values, especially the spikes, seems to coincide with the positive varianceand peaks seen in Figure 3. This coincidence indicates that enzymatic activity at the measured frequency is mirrored negatively in the UV range. Interesting.
The next notable point is the color code scheme in a 3D object with divisions based upon absorptivity. Having two shades of green (0A-2A) seemingly representing go or good; yellow and orange (2A-3.5A), representing caution or warm; red (3.5A-4A) representing stop or hot; and two shades of blue (0A- -2.5A) in the UV range representing cold and negative. The darker green is between 0A and 1A and is the range used for our analysis. But why? This question brings us to the most informative presentation from this (Figure 4) vantage point. At the indicated 405 nm frequency there is a smooth curve representing a dependable change in absorbance (ΔA) ideal for the measurement of AP enzymatic activity. However, that is not the complete answer; that requires the focus on the frequency of 405 nm, resulting in other ways technology makes the study of enzymes cognitively stimulating.
With a look at the 3D models in our rearview mirror, a more informative look at the normal spectral scan is possible. With a look at the indicated 405 nm arrow in Figure 7, perhaps a bit of reflection helps us to recall that activities here, as seen in Figure 3, are mimicked in the UV range, as seen in Figure 6 and now Figure 7. We also see that before the negative activity in the UV range there is a positive activity, which is a point of interest begging an investigation; but that is beyond the scope of this report. Nevertheless, at this point, we have more questions than answers for reasons the manufacturer chose 405 nm as indicated by the arrow. Why not choose 400 nm? It seemed just as good. Or better yet, why not choose a range at the peak that is before 400 nm? The answer to the last question is more directly answerable.
We note that the peak (not before seen) is around 2A or 0.1 to 1%T (transmittance) using the Lambert-Beer’s equation (Absorbance = 2-log%T) for determining absorptivity, and subtle differences could result in large errors. Therefore, our conclusion correlates with research literature stating that small changes at low %T relates to large changes in absorbances and creates greater opportunity for error.1 Even more perilous is a sharp peak that would produce less- or impossibly-reliable results. Therefore, based on our results, greater than 1%T and less than 100%T, usually approaching 1A is desirable in the measurement of the AP enzyme and coincide with medical laboratory science measurements in general. More succinct research shows that 36.8%T or 0.434A presents the least error, but between .1A and .7A or 20%T to 80%T the error is minimum.1
The mystery is finally solved by zooming in on the area of interest, the 405 nm wavelength chosen by the manufacturer and enlarged in Figure 8. Depicted in this figure are the initial reading (purple) and the final reading at 180 seconds (red) at the estimated 405 nm (green) indications. Close examination revealed that the slope moves slightly to the right over time, which brings the absorbance reading increasingly towards an absorbance of one (1A). This view further explains why the manufacturer chose the 400 nm (black dots). The slope of the line is too steep, which would cause more difficulty in making a distinction between absorptivity. Finally, seen is the 405 nm is just before the reduced enzymatic activity.
One last thought, it is known that the accuracy of absorbance is dependent upon a ratio of the natural bandwidth to the spectral bandwidth of less than 10% to produce 99.5% accuracy.1 Therefore, we are led to believe that the diode array of the Lambda 265 is so discerning on an otherwise forebodingly steep slope that it can repetitively produce accurate results. So far that has proven to be the case.
One could ask other questions, such as, how could the manufacturer pinpoint this precise location without technology, or did they have similar technology? One may also speculate that a study of the lag phase as suggested earlier would produce a similar pattern, or would it? Is the background noise in the UV range (190nm~380nm)3 the result of the enzymatic activity on the substrate, or does the substrate cause it? Doing this experiment would prove our speculative statements made concerning the relationships of the positive peaks of activity seen in Figure 3 and the negative ones in Figure 6 in the UV range.
With the technology of the Lambda 265 analyzer, answering these questions are made easy by monitoring the spectrum prior, during, and following the addition of the patient sample containing the alkaline phosphatase (AP). Additional questions are answerable through this approach, such as, “What is the spectral pattern while the reagent is reaching optimum temperature, also, what about the patient sample while it does the same when mixed into the substrate?” Why should students not answer these questions for themselves, rather than relying upon others for the answers? It is called research, brought about by curiosity, aiding the students in the highest levels of cognition—analysis and evaluation—easily accomplished without endangerment with the aid of technology.
References
- Burtis CAA, Edward R.; Bruns, David E. Tietz Fundamentals of Clinical Chemistry. 6 ed 2008.
- Bishop ML, Fody, Edward P.; Schoeff, Larry E. Clinical Chemistry: Principles, Techniques, and Correlations 7ed: Lippincott Williams & Wilkins, a Wolters Kluwer Business; 2013.
- Sciences PLaA. Lambda 265 Users Guide. In: Service LSa, ed. Shelton, CT: PerkinElmer:8.
Gerald Redwine is associate professor at Texas State University Clinical Laboratory Science program in San Marcos, Texas.